A bitcoin live chart shows how BTCUSD traded over a chosen timeframe. Candles are not predictions—they are a history of open, high, low, and close. If you only glance at a green day after a Fed headline, you will overfit noise.
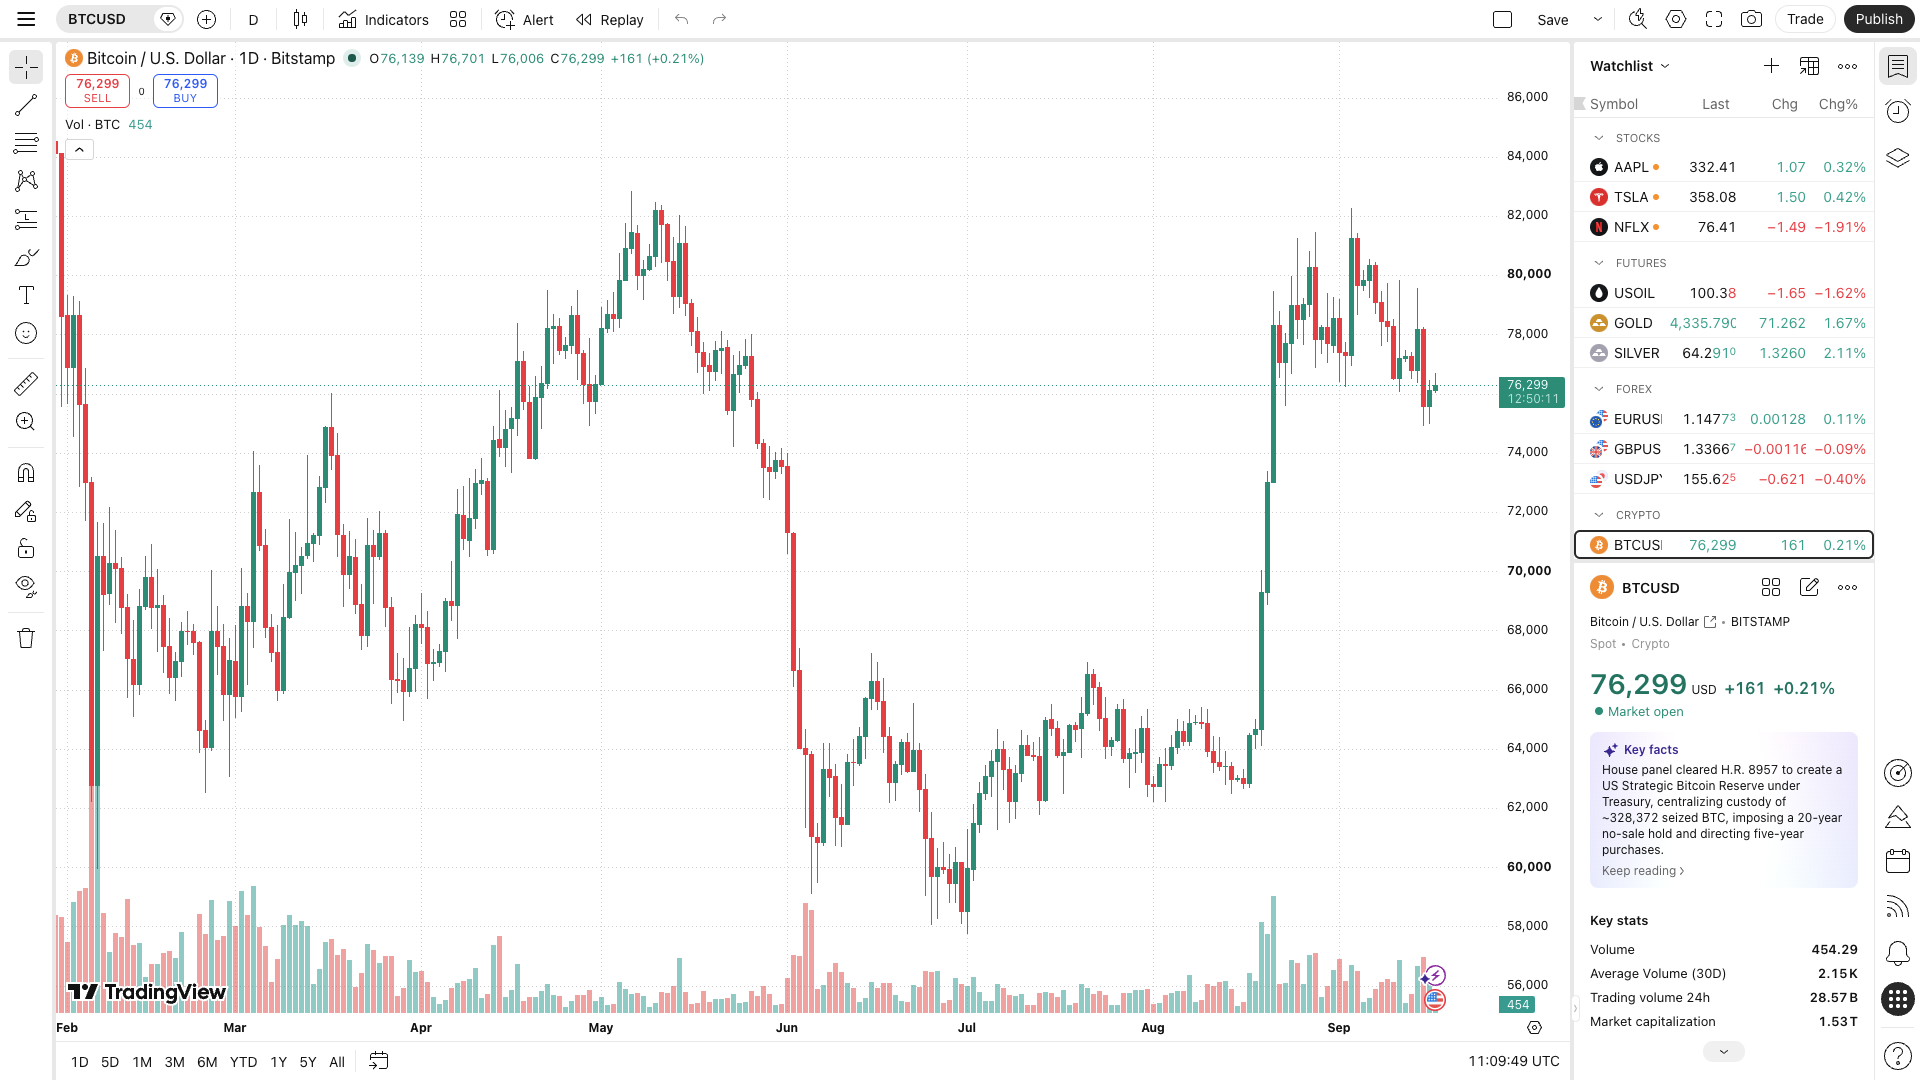
Snapshot from TradingView / Bitstamp BTCUSD. For a live view open TradingView BTCUSD. Also keep the hub page: bitcoin price today.
Timeframes that matter
On a bitcoin live chart, the interval decides what story you see. One-minute charts are for execution noise. One-hour charts show the session. Daily charts show the regime. Weekly charts show whether you are still inside a broader trend or a long consolidation.
Beginners often mix intervals mid-analysis. Pick one primary timeframe, then use one higher timeframe for context. If the daily is a clear downtrend, a five-minute bounce is not a regime change.
Volume, wicks, and fake confidence
Volume rising with a breakout is stronger than a quiet drift. Long wicks show rejection. Do not treat a single wick as destiny. Cross-check whether you are looking at spot BTCUSD or a perpetual mark—funding and basis can pull derivatives away from spot.
Spot vs perpetual on the chart
Many “BTCUSD” widgets are fine. Some boards default to perpetual indexes. For “bitcoin price today” style reading, prefer spot. If you must use perps, know that the chart can disagree with cash markets for hours.
Fed weeks on a live chart
Federal Reserve days compress time. Spreads widen, wicks lengthen, and stop runs are common. A bitcoin live chart is useful for seeing that volatility happened; it is a poor tool for declaring the final macro thesis in the first fifteen minutes.
Common mistakes
- Switching timeframes until the picture looks bullish.
- Ignoring that USD and USDT pairs can print different numbers.
- Confusing exchange-specific prints with a global “the” price.
- Trading a headline without a predefined invalidation level.
How this page fits the hub
This page teaches chart reading. The hub page tracks bitcoin price today in narrative form and links the rest of the cluster. Use both: chart skill here, daily context there—bitcoin price today.
FAQ
What is a bitcoin live chart?
A updating view of BTCUSD candles and volume over a timeframe you choose.
Which timeframe should beginners use?
Start with daily for context, then one-hour for session detail.
Why does my chart differ from another site?
Venue, pair (USD vs USDT), and whether the feed is spot or derivatives.
Can a live chart predict Fed outcomes?
No. It records reactions after the fact.
Where should I go for price-today context?
Bitcoin price today (live outlook).
Related reading
Join the live room
Want live Bitcoin price alerts and Fed decision flash notes? Use the community page join button—we never post invite links that ask for seed phrases.
Get live signals & updates → WhatsApp / community group
Community updates only. Not investment advice.